


Are Continued Jobless Claims a Useful Gauge of Labor Market Conditions?
A recent On the Economy post by Michael McCracken and Trần Khánh Ngân revisited a 2011 Economic Synopses essay by Kevin Kliesen, Michael McCracken and Linpeng Zheng. In that essay, the authors examined whether there exists a threshold of initial claims for jobless benefits that indicates a turning point in labor market conditions: Initial claims rising above this level signal weakening conditions, while claims falling below this level signal improving conditions. The rule of thumb threshold commonly used by business economists is 400,000 claims. While the updated results differed modestly across the business cycle, the blog post found that the story largely remained the same as in the 2011 essay: The 400,000 threshold remains a reasonable rule of thumb.
Here we investigate the same issue but from a different angle. When initial claims data are released each week, continued claims data are also provided. Initial claims are those associated with workers who are starting to receive unemployment insurance. Continued claims are those associated with workers who are, and have been, receiving unemployment insurance. While the former may be a more natural indicator of weakening in the labor market since they indicate that people have recently lost a job, continued claims might also be a reasonable indicator. The argument is that an increase in continued claims means that more people are not finding jobs worth taking, relative to remaining on unemployment insurance.
Determining the Optimal Threshold for Continued Claims
Following that recent On the Economy post, we consider whether such a rule of thumb applies to continued claims and employment growth by running the same threshold regression as in that earlier post. The goal is to determine the relationship between the one-month-ahead growth rate in total nonfarm payroll and the current month’s average continued claims. Since we have no a priori rule of thumb for this relationship, we try an array of thresholds and report the one that yields the highest accuracy in predicting future change in nonfarm employment—henceforth the “optimal” threshold.
To account for the possibility that the optimal threshold has evolved with structural changes in the economy, we do this exercise for 10-year rolling samples between 1967 and 2024. We first estimate our model with (1) employment change between February 1967 and January 1977 and (2) continued claims data between January 1967 and December 1976, i.e., on a one-month lag relative to employment. We then estimate the model with (1) employment change between March 1967 and February 1977 and (2) continued claims data between February 1967 and January 1977. We repeat this process, maintaining a window size of 10 years (120 months), until we reach the end of the data in December 2024.
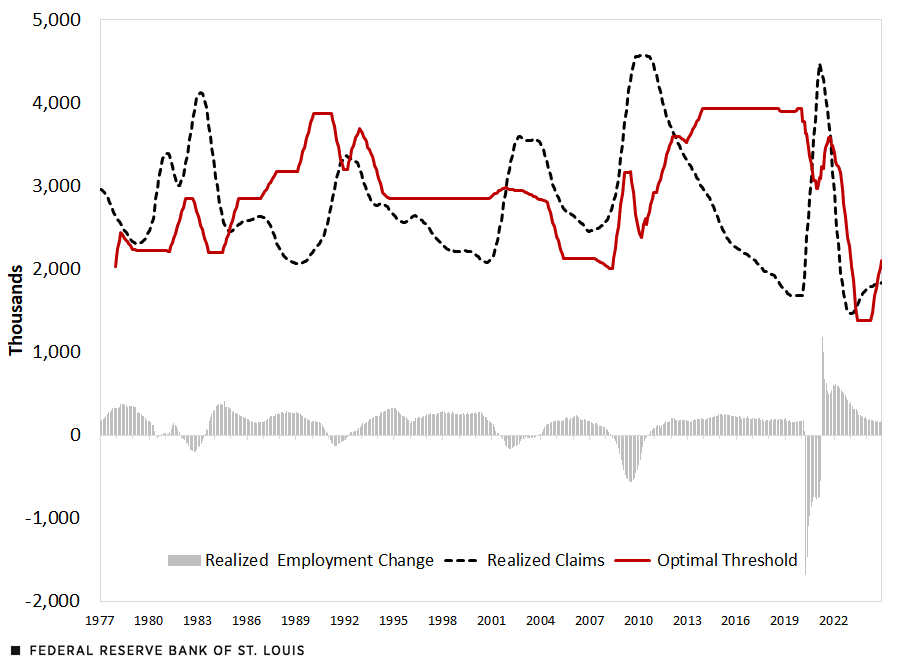
The first figure plots the 12-month moving average of the optimal continued claims threshold, in solid red, and the 12-month moving average of the actual number of continued claims, in dashed black. For context, we also provide the 12-month moving average of actual change in total nonfarm employment, in gray columns.
Realized Continued Jobless Claims Relative to an Optimal Threshold
SOURCES: Bureau of Labor Statistics and Labor Department (retrieved via Haver Analytics) and authors’ calculations.
NOTE: Realized data are 12-month moving averages.
The threshold varies significantly over time, though on average, it is close to 3 million.On average, continued claims are about 7.5 times larger than initial claims. The average optimal threshold for continued claims stands around 3 million. Interestingly, this figure is 7.5 times larger than the 400,000 rule of thumb for initial claims. After the Great Recession (2007-09), the estimated optimal threshold rose to roughly 4 million before sharply declining to roughly 1.4 million—the lowest value it has taken across our sample.
Which Claims Are More Accurate?
It’s important to note, however, that optimal does not mean useful. Just because we obtained optimal thresholds when using continued claims, it does not mean those thresholds are useful or are an improvement relative to using initial claims. Put differently, there may be a reason that business economists have a rule of thumb for initial claims but not for continued claims. Perhaps it is known that initial claims are a better predictor of employment growth than continued claims.
To assess this possibility, for both initial and continued claims, we plot a measure of relative model fit associated with the selected optimal thresholds across each 10-year window.We use the residual sum of squares as the measure of model fit. Note that the same number of parameters is used in every threshold regression. We plot the percent difference in the residual sum of squares when using continued claims relative to initial claims. (See the second figure.) Values greater than zero imply initial claims are more accurate; values less than zero imply continued claims are more accurate.
Comparing Model Fit between Continued and Initial Jobless Claims

SOURCES: Bureau of Labor Statistics and Labor Department (retrieved via Haver Analytics) and authors’ calculations.
NOTE: Realized data are 12-month moving averages.
Across the entire sample, it is nearly always the case that initial claims are more accurate, with gains in accuracy often greater than 20%. The primary exception is the period since the summer of 2020, over which continued claims are more accurate, with gains of roughly 15%. Overall, it does seem that initial claims have been a better predictor of employment growth, though there is some evidence that continued claims have become more competitive.
Notes
- On average, continued claims are about 7.5 times larger than initial claims. The average optimal threshold for continued claims stands around 3 million. Interestingly, this figure is 7.5 times larger than the 400,000 rule of thumb for initial claims.
- We use the residual sum of squares as the measure of model fit. Note that the same number of parameters is used in every threshold regression. We plot the percent difference in the residual sum of squares when using continued claims relative to initial claims.


Citation
Michael W. McCracken and Anna Cole, ldquoAre Continued Jobless Claims a Useful Gauge of Labor Market Conditions?,rdquo St. Louis Fed On the Economy, March 25, 2025.
This blog offers commentary, analysis and data from our economists and experts. Views expressed are not necessarily those of the St. Louis Fed or Federal Reserve System.
Email Us
All other blog-related questions