


The Fiscal Origin of the COVID-19 Price Surge
In my previous blog post, I analyzed the recent inflation episode. Inflation, which was and remains a broad-based phenomenon, peaked in mid-2022 and has since declined sharply, though progress toward the Federal Reserve’s 2% target may have recently stalled. Five years after the start of the COVID-19 pandemic, prices are 10% above their prepandemic trend. In this post, I will argue that inflation was primarily the product of the fiscal deficits incurred in response to the pandemic. Furthermore, significant fiscal deficits are likely to persist, providing further inflationary risk ahead.
Possible Causes of the COVID-19 Inflation
There are differing hypotheses for what caused the recent inflation episode.For an overview of different mechanisms that may cause inflation, see this April 2024 essay, “Prices, Wages and Workers: The Recent U.S. Inflation Experience,” written by David Wheelock and me. One such view was articulated by Fed Chair Powell in his 2024 speech at Jackson Hole. In this narrative, inflation was the product of strained supply chains, a shift in consumer demand toward goods, pent-up demand, stimulative fiscal policy and other pandemic-specific and global factors.For a formal decomposition of the recent inflation episode along these lines, see Miguel Faria e Castro’s Jan. 6, 2025, blog post, “A Look at Inflation in Recent Years through the Lens of a Macroeconomic Model.” According to this view, the strong, if somewhat delayed, monetary policy response was eventually responsible for bringing inflation down, while keeping medium- and long-term inflation expectations anchored and achieving what, so far, looks like a soft landing.
There is an alternative narrative that instead attributes the COVID-19 price surge primarily to the deficits incurred to finance the fiscal assistance provided during the pandemic and assigns a limited role to monetary policy in counteracting it. In this view, demand and supply shocks still played a meaningful role, though they were secondary to fiscal deficits and mostly affected the timing of inflation.
This alternative view is rooted in classic economic theories of price and inflation determination. Basically, the supply of nominal government liabilities determines, for a given demand, the price level. Similarly, inflation is the result of the growth of the supply of government liabilities outpacing the growth of demand.
But which government liabilities? The distinction is important to two competing explanations of prices and inflation: monetarism and the fiscal theory of the price level.The monetarist tradition is mostly associated with the work of Milton Friedman in the 1960s. The origins of the fiscal theory of the price level can be traced back to the insights provided by the work of Thomas Sargent and Neil Wallace in the 1980s. Both traditions remain active in academic research.
Monetarism relates the price level to the supply and demand of money. In modern advanced economies, most money takes the form of bank deposits created by banks, so supply is defined as a broad monetary aggregate such as M2.M2 includes currency, checking and savings deposits, small-denomination time-deposits and retail money market funds. See this Federal Reserve webpage for definitions of several monetary aggregates. The fiscal theory of the price level instead links prices and inflation to the level of government debt and expected future fiscal surpluses.For a recent and comprehensive treatment of the theory and its implications, see The Fiscal Theory of the Price Level by John Cochrane. Both theories recognize the fiscal-deficit origins of inflation, despite disagreeing on the ultimate mechanism (money or debt). Viewed in this light, can they help explain the recent inflation episode and provide an outlook for the future?
The Growth of M2 and Federal Debt
The first figure shows the monthly evolution of the stock of M2 and the amount of federal debt held by the public.Federal debt held by the public excludes holdings by federal agencies (e.g., the Social Security trust funds) but includes holdings by the Federal Reserve. The two series are shown as logarithmic deviations from 2016-19 average. This means that zero represents the 2016-19 average and values in the vertical axis approximate percentage deviations from that average. As one can see, the series tracked each other closely until about mid-2022. By January 2025, the latest data point available, M2 was about 44% above its 2016-19 average while debt held by the public was about 65% higher than its 2016-19 average.
Money Stock and Federal Debt
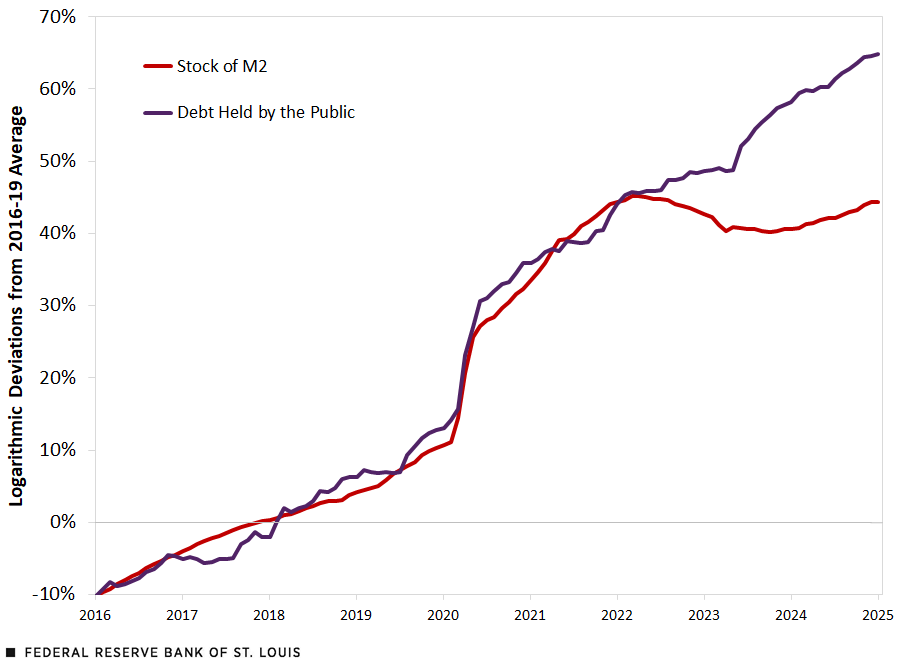
SOURCES: Federal Reserve, U.S. Treasury and author’s calculations.
Both money and debt surged in the early stages of the pandemic and then continued growing at an accelerated pace through 2021. The rise in debt was due to the fiscal assistance provided by the federal government in response to the pandemic. This assistance was not financed with a concurrent increase in taxes but with the issuance of new debt. In all, the primary deficit (the difference between outlays, excluding interest payments and revenues) went from 2.9% of gross domestic product (GDP) in fiscal year 2019 to 13.1% of GDP in 2020 and then to 10.6% of GDP in 2021.The U.S. government’s fiscal year begins Oct. 1 and ends Sept. 30 of the subsequent year; it is designated by the year in which it ends. Figures quoted for fiscal years are from the Congressional Budget Office. Debt held by the public increased from 79% of GDP by the end of fiscal year 2019 to 97% of GDP by the end of 2021. Though debt continued growing after fiscal year 2021, it mostly kept pace with output growth: By the end of fiscal year 2024, debt held by the public reached almost 98% of GDP.
The supply of money, as represented by M2, initially followed a similar pattern: a surge early in the pandemic, followed by accelerated growth through 2021. In contrast to debt, M2 then contracted until the end of 2023 and resumed growing at a slower pace during 2024.
The Role of Deficit Financing the Pandemic Fiscal Assistance
What explains the similar behavior of money and debt in 2020-21 and their different patterns afterward? As mentioned, the surge in the federal debt was due to the pandemic fiscal assistance. This assistance largely took the form of direct transfers to individuals and was financed with new debt. Using data from the flow of funds, I estimate that about four-fifths of the increase in debt in 2020 and 2021 was absorbed by the Federal Reserve, banks and money market mutual funds.
The end result of this deficit-financed fiscal assistance was an increase in deposits, whose main counterpart was an increase in bond holdings in the financial sector (including the Fed). Note that the result is the same, regardless of whether it is the Federal Reserve or depository institutions that “monetize” the new debt. Monetary policy still plays a meaningful role, by setting short-term interest rates that largely determine government bond prices and hence affect their demand. The monetization of government debt could then be a symptom of insufficient demand from the nonfinancial private sector, at prevailing interest rates.
The situation was very different for the years 2022 to 2024: The financial sector as a whole lowered its holdings of Treasury securities, driven by the Feds’ quantitative tightening, and the increase in debt was absorbed by the domestic nonfinancial sector (i.e., households, nonprofit organizations and nonfinancial businesses) and the rest of the world. In the end, there was a substitution from deposits to bonds in the private nonfinancial sector’s balance sheet, which explains the different path for M2 (which contracted) relative to debt (which increased).
Given the differing paths of money and debt described above, one could interpret the ultimate growth of M2 as the portion of the pandemic fiscal deficits that needed to be monetized due to insufficient demand for new debt from the nonfinancial private sector, given the Federal Reserve’s interest rate policy. In other words, had households and firms demanded all the debt issued during the pandemic (essentially, using the transfers to buy bonds), we would likely have seen M2 grow at its prepandemic trend (instead of surging in early 2020). Note that this interpretation does not help us determine whether monetarism or the fiscal theory of the price level is correct (one would need to know the demand for both money and bonds, separately). But it does help us focus on M2 to understand the effects of the pandemic deficits on the price level.
The second figure displays the evolution of the stock of money and the price level, relative to their 2016-19 trend.Removing the respective trends from money and prices acknowledges that these variables may grow at different rates in normal times. The difference in trends may be due to real GDP growth (which directly affects the growth in real money demand) or secular trends in the velocity of circulation (e.g., because financial innovation allows households and firms to economize on real balances). That is, if a variable was on its prepandemic trend, it would be equal to zero. As the figure reveals, both money and prices were well above zero by the end of 2024, indicating that they both grew faster than their respective prepandemic trends.
Prices, represented by the personal consumption expenditures (PCE) price index excluding energy, were about 10% above their prepandemic trend by January 2025. The stock of money, represented by M2, was about 11% above its prepandemic trend. Note, however, that the initial surge in the stock of money in 2020 did not immediately materialize in higher prices. Prices started taking off from their prepandemic trend in 2021. This difference in timing could be explained by supply and demand factors (and perhaps to some extent, also by the relative infrequency with which some prices are adjusted).
Money Stock and the Price Level
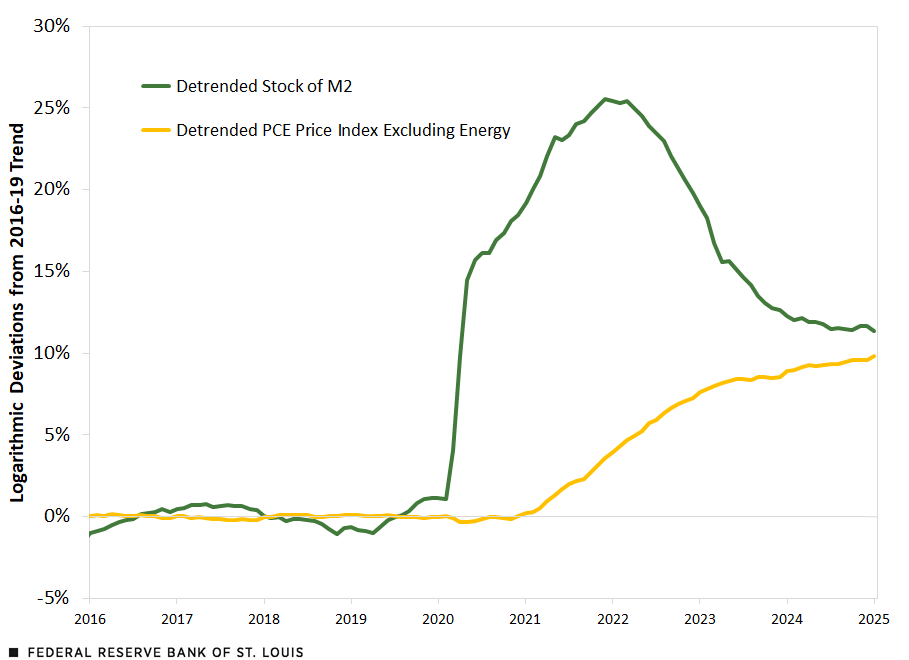
SOURCES: Federal Reserve, Bureau of Economic Analysis and author’s calculations.
In a recent working paper, University of Miami professor David Andolfatto and I studied the COVID-19 price surge to understand the roles played by fiscal and monetary policies in a model developed from the theoretical principles described above.See “Monetary Policy and the Great COVID-19 Price Level Shock,” Federal Reserve Bank of St. Louis Working Paper 2025-004A, February 2025. We argue that the extraordinary fiscal transfers made in 2020 and 2021 generally improved economic welfare, through insuring those that were hardest hit, but these transfers were significantly larger than needed. And though monetary policy muted the inflation dynamic, it did not significantly alter the total amount of inflation experienced. Monetary policy could have prevented the inflation surge with sufficient fiscal support,The fiscal support would take the form of increased tax revenue necessary to finance the higher cost of the debt. but at the cost of a permanently higher real interest rate and a permanently lower level of economic activity.
The Fiscal Outlook
The third figure provides the fiscal outlook based on the latest projections by the Congressional Budget Office (CBO). The figure starts in 1980 to provide historical context and includes the current projections for 2025 to 2035. All years are fiscal years.
The Fiscal Outlook
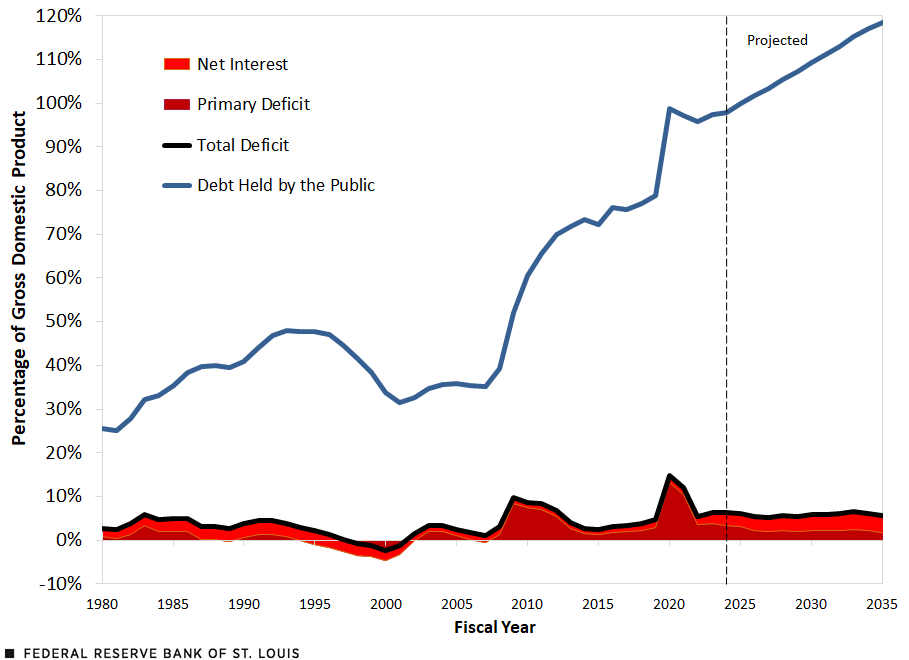
SOURCE: Congressional Budget Office.
In the period prior to the 2007-08 financial crisis, the federal government’s primary deficit (the total deficit excluding net interest) averaged zero. That is, periods of primary deficits were roughly offset by periods of primary surpluses. Total deficits were positive, on average, due to the financial cost of servicing the debt.
In the aftermath of the financial crisis, primary deficits became persistent, and debt grew significantly as a percentage of GDP. The COVID-19 pandemic reinforced these trends. Furthermore, as interest rates rose, so did the financial burden of increased debt. By fiscal year 2024, the primary deficit was 3.3% of GDP, and interest payments represented 3.1% of GDP (the highest since 1995). As mentioned above, debt held by the public reached about 98% of GDP.
The 10-year budget outlook from the CBO estimates that primary deficits will persist while the debt will continue to grow and become an increasing financial burden. These projections are made under the current law and changes to the law could alter the outlook. For example, extending the 2017 individual income tax cuts would add about $3.7 trillion to the deficit over the next 10 years, about 1% of GDP per year, on average, according to the CBO. On the other hand, if efforts toward fiscal consolidation or pro-growth policies turn out to be successful and substantial, then the fiscal outlook could improve and break its current trajectory.
Inflation Risks Ahead
Fiscal policy poses an inflationary risk. As supported by economic theory and evidenced by recent experience, large fiscal expansions, particularly in the form of transfers to individuals, that are financed by debt and not expected to be reduced with future surpluses may translate into higher prices.
The counteracting force to a deficit-financed fiscal expansion is a permanent increase in the demand for government liabilities. Economic growth is one source of increased demand. Another is flight-to-safety, which shifts private balance sheets away from risky assets into safer assets, particularly government debt.This latter phenomenon may explain the lack of inflation during the financial crisis.
The COVID-19 inflation episode suggests that the fiscal expansion in 2020 and 2021 was ultimately not supported by a higher demand for government liabilities, which resulted in a permanent increase in the price level (manifested as a prolonged inflationary process). The fiscal outlook, as it currently stands, offers a warning of further inflationary risk ahead.
Notes
- For an overview of different mechanisms that may cause inflation, see this April 2024 essay, “Prices, Wages and Workers: The Recent U.S. Inflation Experience,” written by David Wheelock and me.
- For a formal decomposition of the recent inflation episode along these lines, see Miguel Faria e Castro’s Jan. 6, 2025, blog post, “A Look at Inflation in Recent Years through the Lens of a Macroeconomic Model.”
- The monetarist tradition is mostly associated with the work of Milton Friedman in the 1960s. The origins of the fiscal theory of the price level can be traced back to the insights provided by the work of Thomas Sargent and Neil Wallace in the 1980s. Both traditions remain active in academic research.
- M2 includes currency, checking and savings deposits, small-denomination time-deposits and retail money market funds. See this Federal Reserve webpage for definitions of several monetary aggregates.
- For a recent and comprehensive treatment of the theory and its implications, see The Fiscal Theory of the Price Level by John Cochrane.
- Federal debt held by the public excludes holdings by federal agencies (e.g., the Social Security trust funds) but includes holdings by the Federal Reserve.
- The U.S. government’s fiscal year begins Oct. 1 and ends Sept. 30 of the subsequent year; it is designated by the year in which it ends. Figures quoted for fiscal years are from the Congressional Budget Office.
- Removing the respective trends from money and prices acknowledges that these variables may grow at different rates in normal times. The difference in trends may be due to real GDP growth (which directly affects the growth in real money demand) or secular trends in the velocity of circulation (e.g., because financial innovation allows households and firms to economize on real balances).
- See “Monetary Policy and the Great COVID-19 Price Level Shock,” Federal Reserve Bank of St. Louis Working Paper 2025-004A, February 2025.
- The fiscal support would take the form of increased tax revenue necessary to finance the higher cost of the debt.
- This latter phenomenon may explain the lack of inflation during the financial crisis.

Citation
Fernando M. Martin, ldquoThe Fiscal Origin of the COVID-19 Price Surge,rdquo St. Louis Fed On the Economy, March 6, 2025.
This blog offers commentary, analysis and data from our economists and experts. Views expressed are not necessarily those of the St. Louis Fed or Federal Reserve System.
Email Us
All other blog-related questions